Why Monitor Your Microservices?
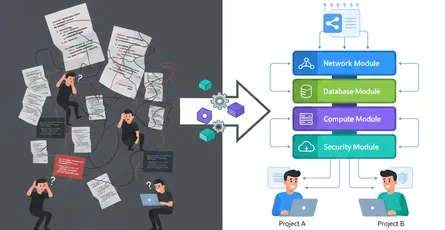
The Complexity of Distributed Systems
Hey, want to know what’s going on in your microservices?
If you’re juggling multiple services, it’s hard to track how they work together. OpenTelemetry helps you follow requests and find problems quickly, like a map for your code.
Business Impact of Poor Observability
Without proper monitoring, microservices can become a black box, making it impossible to understand system behavior or diagnose issues effectively.
The Challenge of Microservices Observability
Debugging Distributed Systems
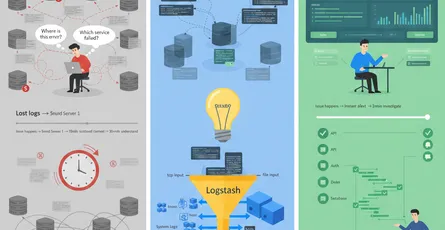
What’s the problem?
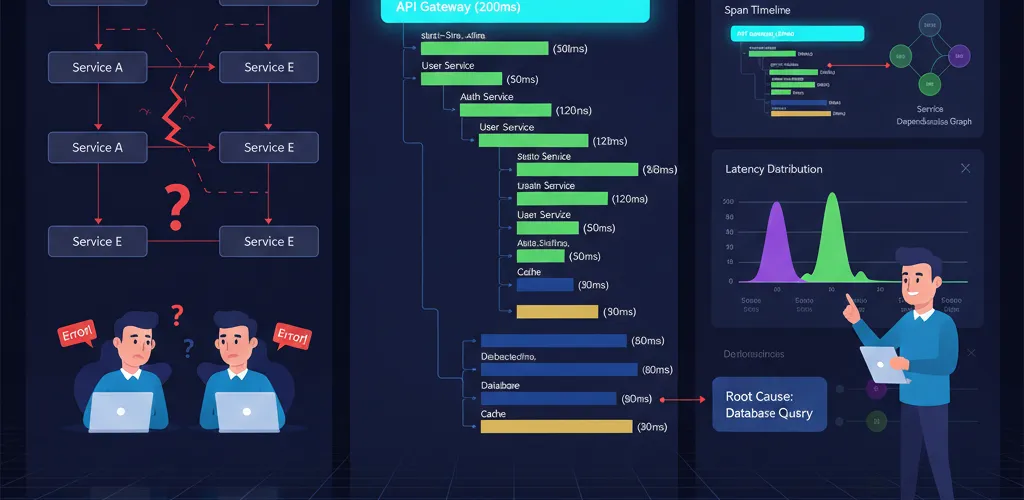
With microservices, one slow or broken part can mess everything up. Without a clear way to see what’s happening, you’re left guessing where the issue is, wasting time and patience.
The Cascade Effect
A single failing service can trigger failures across the entire system, making root cause analysis extremely difficult without proper tracing.
Traditional Monitoring Limitations
Logs and metrics alone aren’t sufficient for understanding request flows across service boundaries.
The Solution: OpenTelemetry Distributed Tracing
How Distributed Tracing Works
Here’s how to fix it
OpenTelemetry is a free tool that tracks requests as they move through your services. Add its libraries to your code, set up a collector to grab the data, and send it to something like Jaeger or Zipkin. You’ll get a visual guide showing exactly where things slow down or break.
Instrumentation Process
Add its libraries to your code, set up a collector to grab the data, and send it to something like Jaeger or Zipkin.
Visualization and Analysis
You’ll get a visual guide showing exactly where things slow down or break, making bottlenecks and errors immediately apparent.
Quick Implementation Steps
Library Integration
Quick takeaways
- Add OpenTelemetry libraries to your services.
- Set up a collector to feed data to a visualization tool.
- Check traces regularly to spot and fix issues fast.
Collector Configuration
Set up a collector to feed data to a visualization tool like Jaeger, Zipkin, or cloud-based observability platforms.
Ongoing Monitoring
Check traces regularly to spot and fix issues fast, establishing a culture of proactive system monitoring.
Benefits of OpenTelemetry Tracing
Faster Problem Resolution
Why it’s awesome?
Adding OpenTelemetry to your setup helps you catch problems early, saving you from long debugging sessions. It makes your system more reliable and gives you a clear view of how everything connects.
Improved System Reliability
Early problem detection prevents issues from cascading through your microservices architecture.
Better System Understanding
Gain a clear view of how everything connects, improving both development and operations teams’ understanding of the system.
What’s Your Monitoring Strategy?
Community Approaches
What’s your go-to?
How do you keep tabs on your microservices? Got any favorite tools to share?
Tool Comparisons
Whether you’re using Jaeger, Zipkin, DataDog, or other observability platforms, share your experiences and preferences.